Unlocking Product Insights with PostHog: A Practical Guide to Product and Web Analytics

Product decisions need data. PostHog is an open-source analytics platform that combines product analytics, web analytics, session recordings, and feature flags in a single tool. Here's a practical guide to getting the most out of it.
Why PostHog?
Most teams start analytics with one question: "Are users actually using what we built?" PostHog helps you answer that — and much more:
- Which features do users actually use?
- Where do users drop off in key workflows?
- How do different user segments interact with the product?
- What is the conversion rate for critical actions?
- Where is our web traffic coming from?
Without analytics, you're guessing. PostHog gives you the data to answer these questions from a single platform, without stitching together multiple tools.
Part 1: Product Analytics
Identifying and Tracking Key Events
The foundation of PostHog is event tracking. An event is any meaningful user action — clicking a button, submitting a form, visiting a page. You define what matters for your product.
Good events to track:
- Feature accessed (user opens a key module)
- Workflow started (user begins a multi-step process)
- Workflow completed (user finishes the process)
- Business action taken (user creates/sends/updates something)
Tip: Use a consistent naming convention like feature_accessed, form_submitted, workflow_completed. This makes querying and building dashboards much easier.
User Identification and Segmentation
When users log in, identify them in PostHog so you can segment analytics by user properties:
posthog.identify(userId, {
  email: user.email,
  role: user.role,       // e.g. admin, editor, viewer
  plan: user.plan,       // e.g. free, pro, enterprise
});
This lets you answer questions like:
- Do Pro users use Feature X more than Free users?
- Do Admin users complete the onboarding workflow at a higher rate?
Avoid storing sensitive PII beyond what's needed for segmentation. User ID, role, and plan tier are usually sufficient.
Feature Adoption Tracking
Track when users access your major features to understand what's being used:
posthog.capture('feature_accessed', {
  feature: 'reporting_dashboard',
  source: 'sidebar_nav',
});
Over time this reveals:
- Which features drive the most engagement
- Which features are underutilised despite investment
- Which features are "sticky" (users return to them regularly)
Funnel Analysis: Finding Drop-Off Points
Funnel analysis is one of PostHog's most powerful capabilities. For any multi-step workflow, you can build a funnel to see where users drop off.
Example: A 5-step onboarding funnel
| Step | Event | Conversion |
|---|---|---|
| 1 | signup_completed | 100% |
| 2 | onboarding_started | 82% |
| 3 | profile_setup_done | 61% |
| 4 | first_feature_used | 44% |
| 5 | onboarding_completed | 31% |
From this you can immediately see that the biggest drop-off is between steps 3 and 4. That's where to focus improvement efforts.
In PostHog, you build funnels by selecting the ordered sequence of events and filtering by date range, user properties, or cohorts.
Cohort Analysis
Group users into cohorts based on shared properties or behaviours and compare how they use your product:
- Users who signed up in January vs February
- Power users (more than 10 sessions/week) vs casual users
- Mobile users vs desktop users
Cohort comparison helps you understand which user segments are most successful and what drives retention.
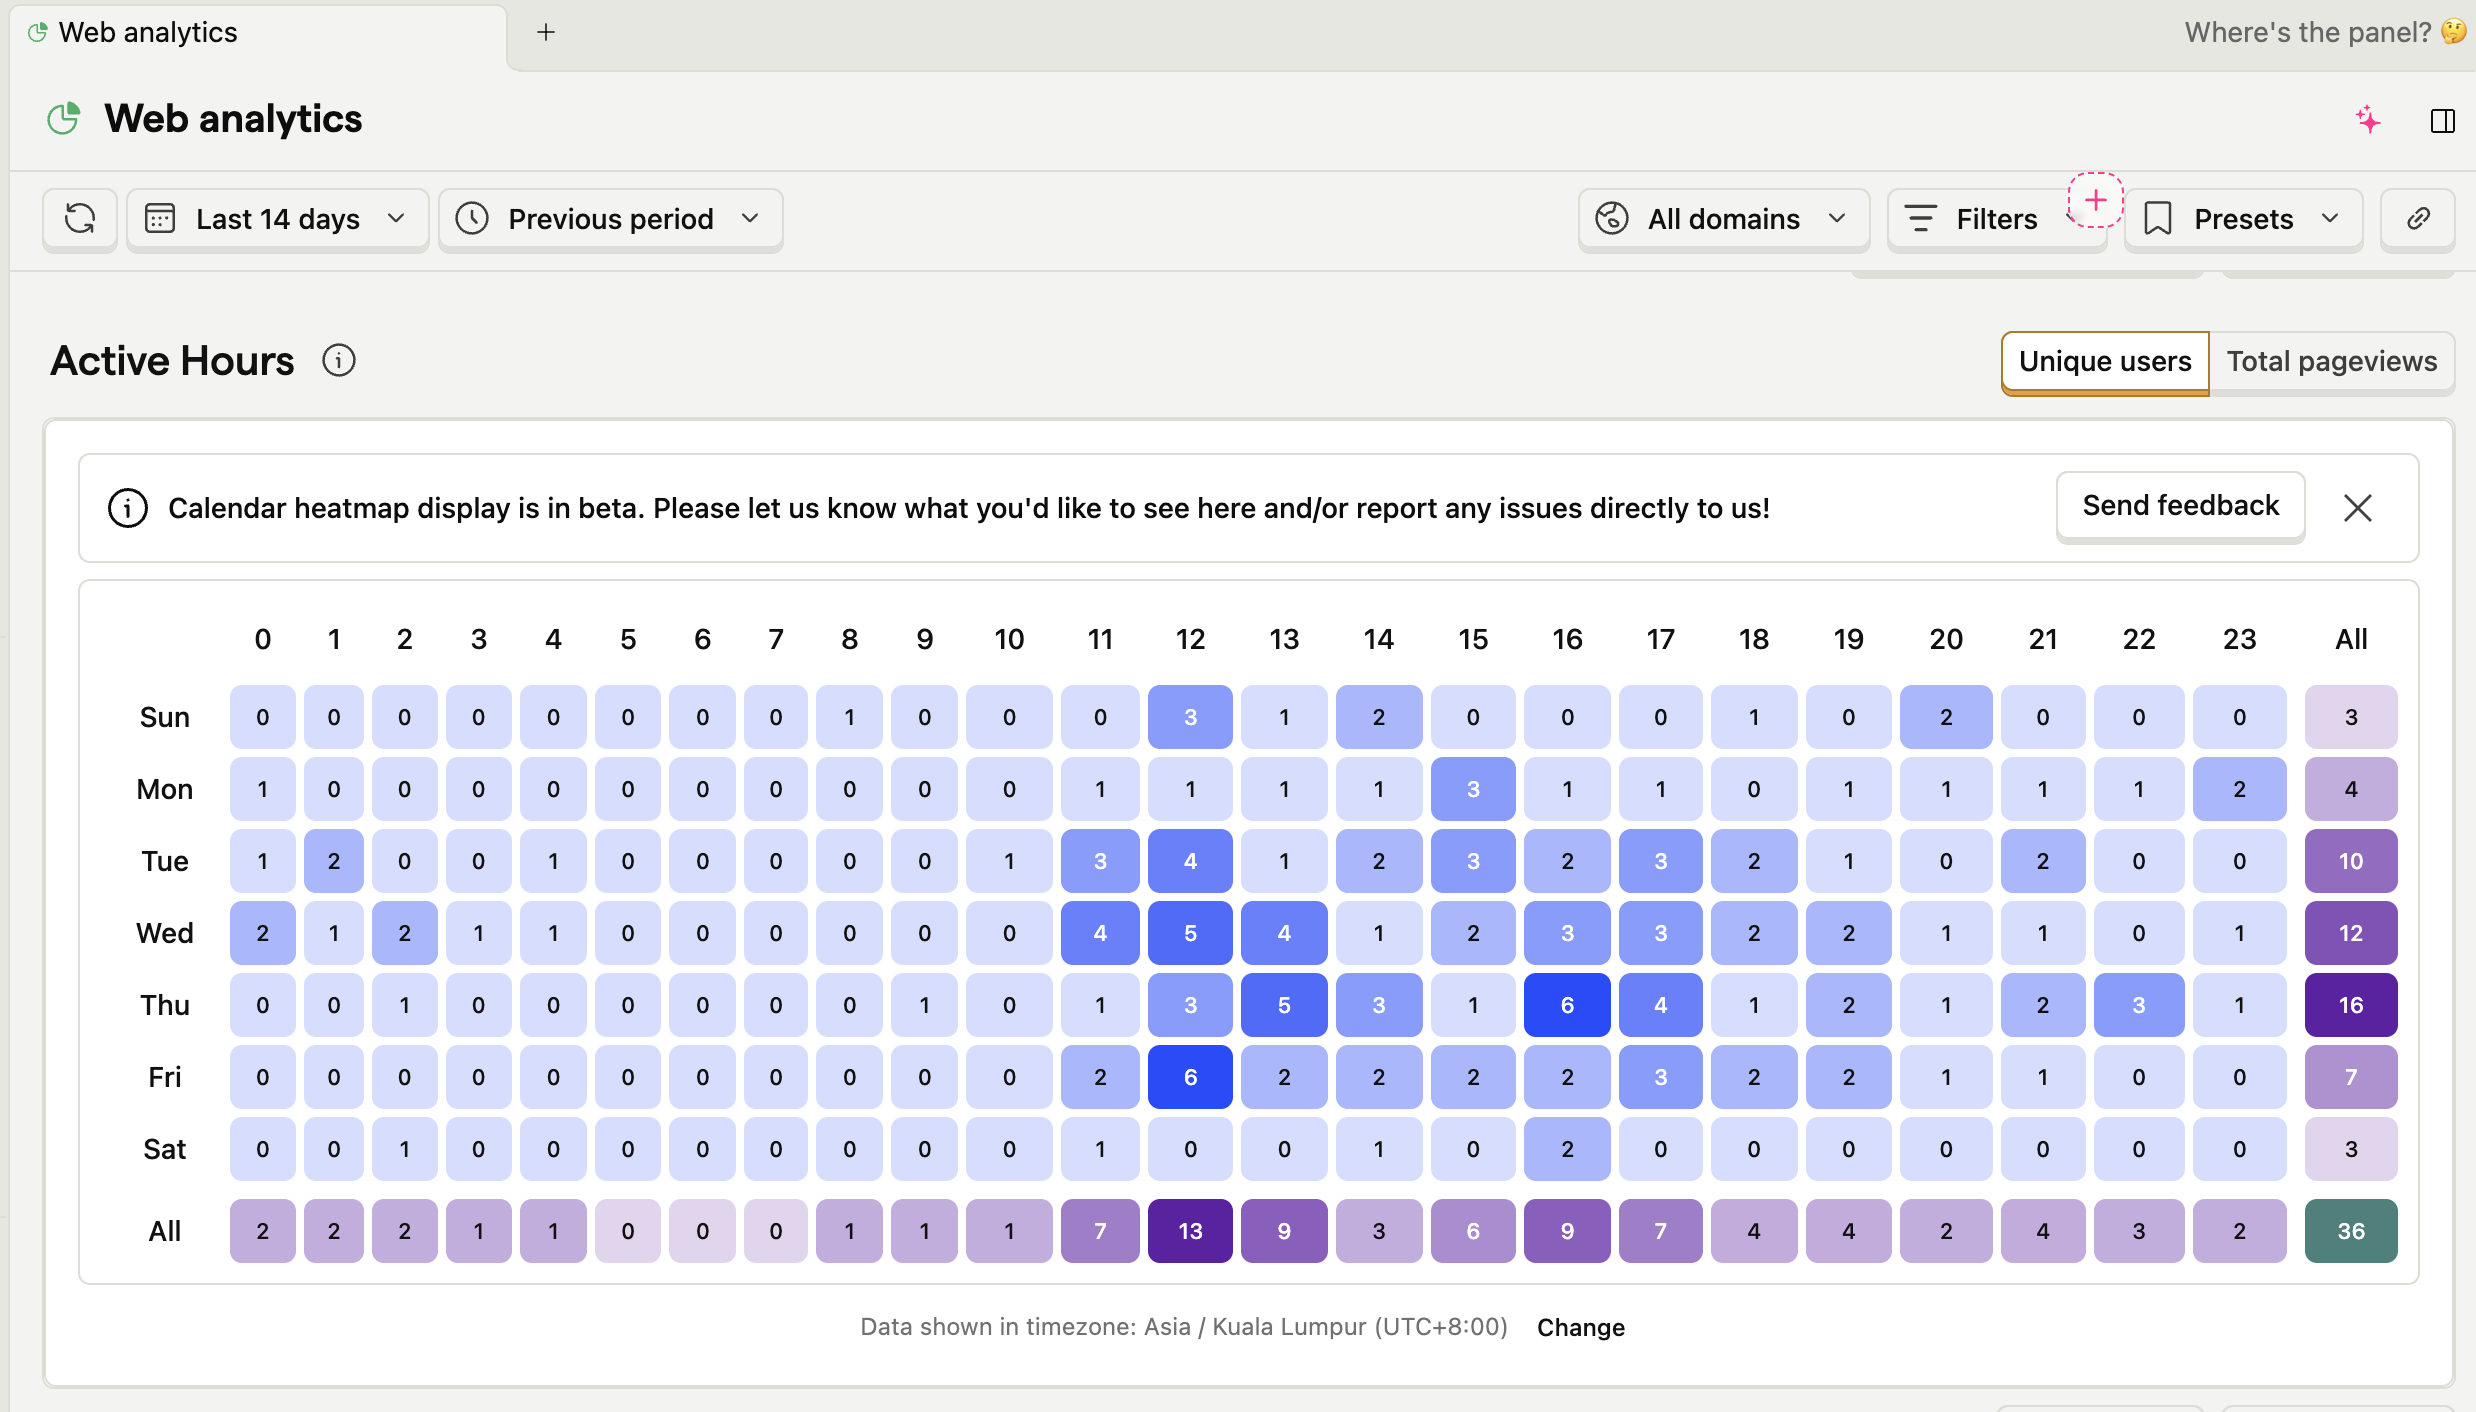
Part 2: Web Analytics
PostHog's Web Analytics dashboard gives you a Google Analytics-style view of your website traffic without the privacy concerns and without needing a separate tool.
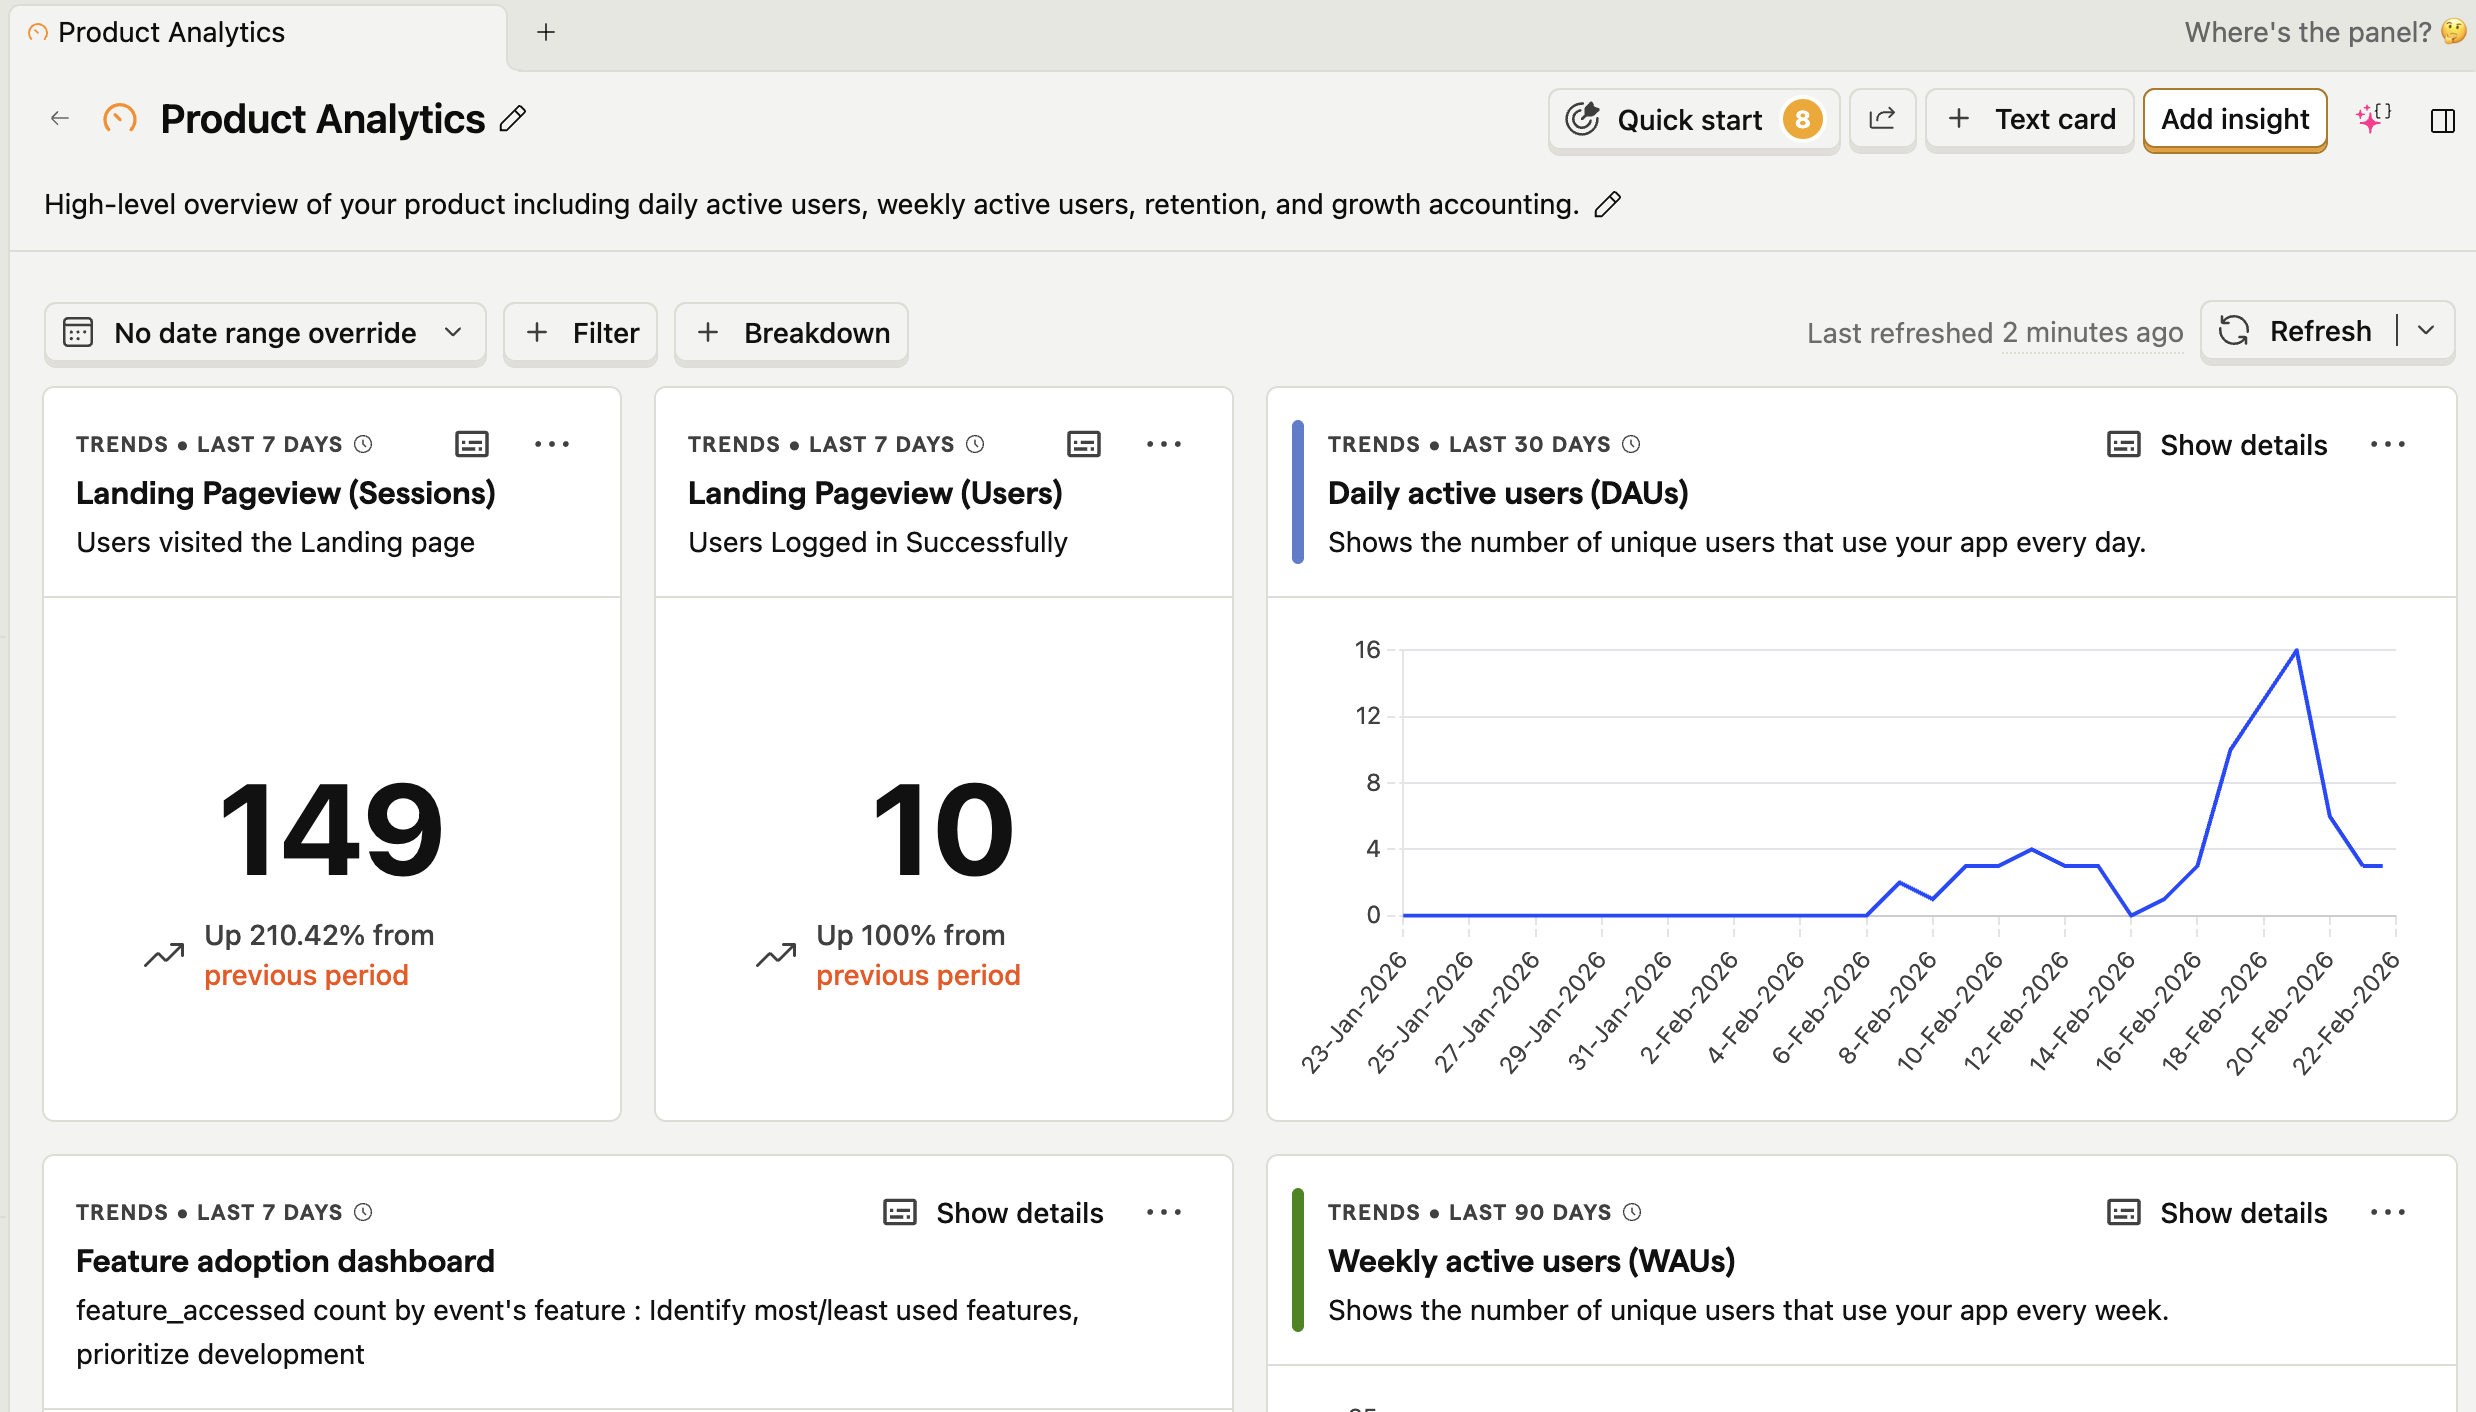
Traffic Overview
The web analytics dashboard shows at a glance:
- Unique visitors — how many individual users visited
- Pageviews — total pages viewed
- Sessions — grouped visits per user
- Bounce rate — percentage of single-page sessions
- Session duration — average time users spend on the site
These metrics are available by day, week, or month, with trend comparisons to previous periods.
Traffic Sources
Understanding where your users come from helps you prioritise marketing and content efforts. PostHog breaks down traffic by:
| Source | What it tells you |
|---|---|
| Direct | Users who typed your URL or came from bookmarks |
| Organic search | Users from Google/Bing — a signal of SEO health |
| Referral | Users from links on other websites |
| Social | Traffic from Twitter, LinkedIn, etc. |
| Traffic from email campaigns (via UTM params) | |
| Paid | Traffic from ads (via UTM params) |
UTM tracking tip: Always append UTM parameters to links you share in campaigns:
https://yoursite.com/blog?utm_source=newsletter&utm_medium=email&utm_campaign=feb-2026
PostHog automatically captures these and attributes sessions correctly.
Top Pages and Entry/Exit Analysis
PostHog shows you:
- Most visited pages — where users spend the most time
- Top entry pages — where users first land on your site
- Top exit pages — where users leave — potential friction points
If a key product page has a high exit rate, that's a signal to investigate with session recordings.
Geographic and Device Breakdown
Understand your audience better with:
- Countries and cities — where your users are located
- Browsers — Chrome, Safari, Firefox, Edge breakdown
- Device type — desktop vs mobile vs tablet
- OS — Windows, macOS, iOS, Android
This helps with decisions like: "Should we invest more in mobile optimisation?" or "Are we supporting the right browsers?"
Web Vitals (Core Web Vitals)
PostHog can track Google's Core Web Vitals directly:
| Metric | What it measures | Good threshold |
|---|---|---|
| LCP (Largest Contentful Paint) | Load performance | < 2.5s |
| FID / INP (Interaction to Next Paint) | Interactivity | < 200ms |
| CLS (Cumulative Layout Shift) | Visual stability | < 0.1 |
Poor Core Web Vitals hurt both user experience and search rankings. Tracking these in PostHog alongside user behaviour data means you can directly correlate slow pages with higher bounce rates.
Part 3: Session Recordings
Session recordings let you watch how real users navigate your product — clicks, scrolls, form interactions, and navigation paths — without seeing any sensitive input data (PostHog masks form fields by default).
When to Use Session Recordings
- After a spike in bounce rate — watch what users do before leaving
- When funnel drop-off increases — see what happens at the step where users quit
- After launching a new UI — validate that users understand and use it as intended
- When support tickets spike — understand what users are experiencing
Heatmaps
PostHog's heatmaps show aggregated click and scroll data across sessions:
- Click maps — which elements get the most clicks (including rage-clicks)
- Scroll depth maps — how far down the page users typically scroll
If users never scroll to your CTA, it doesn't matter how good the copy is.
Part 4: Practical Setup Tips
Error Handling
Wrap PostHog calls so analytics failures never break your app:
try {
  posthog.capture('event_name', { property: value });
} catch (e) {
  // fail silently — analytics should never break the UX
  console.warn('Analytics error:', e);
}
Performance
PostHog's SDK is asynchronous and non-blocking. Load it with the async attribute or via a deferred script to avoid impacting page load time.
Privacy Best Practices
- Don't capture raw form values — PostHog masks inputs by default, keep it that way
- Don't store passwords, payment info, or other sensitive PII in event properties
- Use role/tier rather than email for segmentation where possible
- Check your privacy policy covers analytics data collection
Sampling for High-Traffic Sites
If you have very high traffic, use PostHog's sampling configuration to reduce event volume and cost while maintaining statistical accuracy.
Key Metrics at a Glance
| Category | Metric | Why it matters |
|---|---|---|
| Acquisition | Unique visitors, traffic sources | Where growth comes from |
| Engagement | Session duration, pages/session | How valuable the experience is |
| Retention | Return visitor rate, cohort retention | Whether users come back |
| Conversion | Funnel completion rates | Whether users achieve their goals |
| Performance | Core Web Vitals | Speed and stability |
| Feature Health | Feature adoption rates | What you've built is being used |
Lessons Learned
We've implemented PostHog across multiple products — from SaaS platforms to content-driven web properties — and the results have been consistently eye-opening. With multi-domain tracking configured, we gained a unified view of how users move between marketing sites, product apps, and support portals within the same session. This cross-domain visibility revealed user journeys we simply couldn't see before: users who read a blog post, visited the pricing page on a subdomain, and converted to a trial — all stitched together as a single journey.
Some of the measurable benefits we've seen in practice:
- Reduced funnel drop-off by ~30% after using session recordings to identify and fix a confusing UI step
- Identified that 60%+ of users accessed certain features via mobile, which directly informed our responsive design backlog
- Correlated slow LCP scores with higher bounce rates on specific landing pages, leading to targeted performance improvements
- Discovered that organic search drove the highest-quality signups (lowest churn), shifting our content investment accordingly
- Unified cross-domain user journeys gave us accurate attribution that was previously split across separate analytics accounts
Optimal Implementation Tips
- Start with clear goals — Define what "success" looks like before instrumenting anything. Instrument with purpose, not just to have data.
- Track consistently — Use a naming convention from day one (e.g.
noun_verblikefeature_accessed,form_submitted). Retrofitting event names across a codebase is painful. - Add context to every event — Properties like
user_role,plan,feature_nameunlock powerful segmentation. A bare event with no properties tells you very little. - Build funnels for every key workflow — You can't improve what you can't measure. Start with your most critical user journey.
- Set up cross-domain tracking early — If your product spans multiple domains or subdomains, configure PostHog's cross-domain identity from the start. Adding it later means losing historical continuity.
- Combine product + web analytics — Traffic source data and feature usage data together tell a much richer story than either alone.
- Act on the data — Insights are only valuable if they drive decisions. Schedule a regular analytics review with your team.
Getting Started
- Sign up at posthog.com — generous free tier available (1M events/month)
- Install the SDK for your stack (JS snippet, React, Node, Python, Go, and more)
- Enable Web Analytics in project settings — instant traffic dashboard, no extra code needed
- Define your top 5 events to track in the first sprint
- Build one funnel for your most important user workflow
- Set up one dashboard with the metrics your team cares about most
Conclusion
PostHog brings together product analytics, web analytics, session recordings, and feature flags in one open-source platform. Whether you want to understand where your web traffic comes from, watch users navigate your product, or measure funnel conversion rates — it's all in one place. The insights you'll gain will help you build a better product
Start small, instrument one workflow, and let the data guide your next product decision.